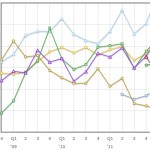
One last look at some post-Q4 numbers, specifically the ratio of enterprise value (EV) to adjusted EBITDA across the sector. This ratio isn’t perfect of course, but it has more inherent comparability than other metrics, as it incorporates net debt (via EV) and alongside the capex/revenue plot gives a decent relative picture of the sector’s various operating models. This plot incorporates not only data for the end of 2012, but includes a real time estimate as its last data point. One can clearly see a recovery in valuation in progress, following the sharp drop in Q3. [Read more →]


