


This Industry Viewpoint was contributed by Matt Walker, Founder & Lead Analyst, MTN Consulting, LLC (https://mtnconsulting.biz/)
The first sizable telcos reported 3Q17 earnings this morning: Verizon and Rogers. Both can point to reassuring bottom line results. For the 9 months ended September, operating & net margins improved year-over-year, as did earnings per share. Rogers’ EPS through September was C$2.66, up 24% YoY, while Verizon’s $2.80 EPS for the same period was up 32% YoY. The results contain some negatives, too; some company-specific, but some illustrative of broader market challenges.
Wireless not always a growth driver
Rogers was an early mover in Canada’s LTE market, and continues to grow its postpaid subscriber base: 8.8M in September 2017, up 3.3% from 3Q16. That 8.8M amounts to roughly 25% of Canada’s population. Wireless revenue growth this year has averaged 5% YoY. The company’s operating margins are reliably in the 40-50% range; in 3Q17, the figure of 47.9% was up a bit from 47.1% in 3Q16. What helps keep the margins high are stable ARPUs and fairly low churn. Rogers’ blended (postpaid + prepaid) wireless ARPU for the year so far is C$61.94, up just under 3% from the 2016 period. Churn in retail postpaid is 1.11% so far this year, down a bit from 1.19% YoY.
Verizon, also a first mover in the US’ LTE market, retains high operating margins in its wireless division: 46.2% for 3Q17, from 44.9% in 3Q16. However, core service revenues are falling: $47.2B in wireless service revenues for 1-3Q17, down 6% YoY. Total wireless division revenues also fell, by a more modest 3.1%. The difference is equipment. Verizon regularly charges more in “cost of equipment” than it books in equipment revenues; that’s not changing. However, Verizon closed the gap significantly in 2017. The implicit loss (or subsidy) from its wireless device sales was $2.4B YTD17, down from $3.1B in 1-3Q16. This narrowing may not be sustainable. New device releases and sales/distribution strategies can often lead to spikes in equipment subsidies.
On the plus side, nearly 95% of Verizon’s subscribers are on smartphones (from 93% a year ago). Churn also remains low at Verizon: for the high value retail postpaid segment, Verizon’s churn was 1.02% so far this year, essentially unchanged from the 0.98% in 1-3Q16.
Cord cutters and OTT
Wireline accounts for about 30% of revenues at Verizon, and 25% at Rogers (over a cable network). Like most big incumbents with fixed access networks (PSTN or cable TV), both offer video platforms combining voice, data & video over an operator-provided CPE. To do this, they’ve invested heavily in network upgrades, workforce training, and sales & marketing over the last 5+ years.
Despite this investment and overall subscriber growth, both operators are reporting net losses in video/TV subscribers. Consumers have far more OTT video options now. Performance over mobile networks often isn’t good (or economical) enough for heavy video users. The incentive to keep your telco/cable-provided Internet service but cancel video is growing stronger.
Rogers’ reported sub losses have been ongoing; its TV subscribers are now 1.75M, down 4% from the prior year. This was worsened due to Rogers’ growing pains with platform development. It spent nearly half a billion C$ trying to develop a proprietary IPTV platform, similar to BCE’s “Fibe TV” platform, before having to write it off. It’s changed strategy, and will now license the Comcast-developed X1 platform.
Verizon’s had more luck with its custom FiOS box. However, it also lost video subscribers in 3Q17. Overall net adds for FiOS in 3Q17 were 59,000: +66K for Internet, +11K for voice, and -18K for video. Margins remain low in wireline, despite some YoY improvement; EBITDA/revenues so far this year in wireline is 21.2% from 17.1% in 1-3Q16. Further, to sustain its wireline business Verizon’s capital spending is higher as a % of revenues: 14.6% so far this year, from 10.9% YTD16.
Overall revenue trends point to caution
The figure below shows recent YoY revenue trends for the two operators. Rogers’ trend is relatively steady; its early lead in LTE and market-leading broadband position has helped with this consistency. The growth rate is just 2-4% per year though.
Verizon’s growth has been negative until recently, held back by weak mobile service revenues. A modest improvement helped push Verizon’s YoY growth to Rogers’ level in 3Q17, +2.5%. Another factor benefiting Verizon’s measured growth recovery is mobile device equipment revenues, up 5.4% so far this year, to 13.5% of corporate revenues.
Even with slow top-line growth, both Rogers & Verizon generate healthy free cash flow in typical quarters, including $3B for Verizon in 3Q17 and C$372M for Rogers in the same period. They have high debt typical of telcos, but interest costs are on the low end.
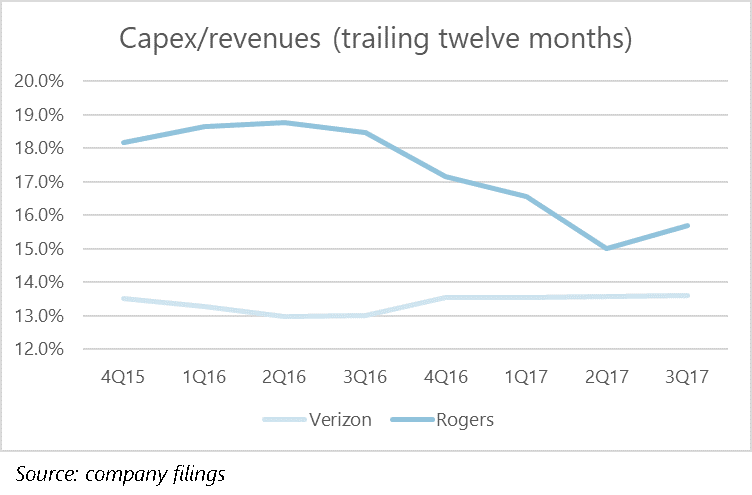
Verizon capex 13-14% of revenues, selective M&A activity likely to continue
On the capex front, Verizon is big but not hard to predict: its annualized capital intensity has been in the narrow 13-14% of revenues range for several years now. Variations in the past have come from quick buildouts to gain market position. As Verizon and other telcos move to more software-centric networks, these variations will be less common and less extreme. It’s unlikely that we’ll see Verizon’s capital intensity rise above the 15% mark anytime soon. For 4Q17, Verizon will likely spend about the same as 4Q16, plus maybe 1-2%.
Verizon’s capex is constrained not just by revenue growth & software-based expansion, but also the need to reserve capital for spectrum and acquisitions. Earlier this year, Verizon purchased Straight Path and its spectrum holdings for $3.1B; in early 2015, Verizon spent $9.9B for AWS-3 spectrum in FCC auctions. On the company’s balance sheet, in fact, the value of spectrum assets (“wireless licenses”) is now slightly higher than net property, plant & equipment (PP&E, net): $88B v. $87B.
And Verizon has a healthy track record of acquisitions. That includes a recent deal to purchase fiber optic assets in Chicago from WOW. That deal was just $225M and for one metro area, but it’s a reminder that Verizon and other deep-pocketed telcos are constantly considering build v. buy alternatives. That’s more the case now, as a sector of neutral network operators (NNO) has matured.
Rogers’ capex levels are looking up
As part of its 3Q17 earnings release, Rogers added C$100M to its 2017 target capex (now C$2.35B-C$2.45B). That modest change is, Rogers says, due to “strong growth in our wireless segment and the intended investment of those incremental profits to further enhance the quality of our networks”.
Even with that, Rogers’ full year 2017 capex/revenues is likely to settle around 16%, low by its historic standards. That’s down, in small part, because of a slowdown in its “NextBox” service while a new platform is being developed: Rogers is set to launch its white label partnership with Comcast sometime in 2018. An X1 success would mean more capex at Rogers. Comcast and it supplier partners, though, may be the main beneficiaries of this growth. At least initially. If the platform takes off and helps reverse Rogers’ video sub declines – and lift ARPUs – you can expect more investment in the core of the network to keep the cord cutters at bay.
Matt Walker is Founder & Lead Analyst at MTN Consulting, LLC (https://mtnconsulting.biz/)
If you haven't already, please take our Reader Survey! Just 3 questions to help us better understand who is reading Telecom Ramblings so we can serve you better!
Categories: Financials · ILECs, PTTs · Industry Viewpoint
Discuss this Post