


This Industry Viewpoint was authored by Rajesh Ramaswamy Sampathkumar, Sumit Thakur, Jagadeesh Bhavanasi, Kalyanakannan D M of Prodapt
Frameworks leveraging Graph Technologies for smart decision making
Rapid network expansion has resulted in creation of data silos amongst Digital Service Providers (DSPs), which affects time-to- insights from their network assets. The scattered set of data needs to be integrated from various set of disjointed systems comprising of untraceable integrations and interfaces. This impacts DSPs key operational processes leading to issues such as, inefficient network and resource utilization, delay in new network design rollout and ineffective network troubleshooting.
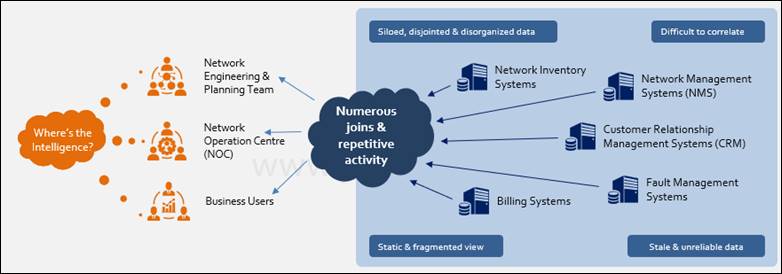
Fig: Data silos causing time-to-insights for the data assets and impacts key operational processes
DSPs have started leveraging Graph database to build 360° network visualization & drive smart decision making
Telecom networks can be naturally modelled as graphs; hence most DSPs have started leveraging graph database to address the problem of data silos and information asymmetry in their network management. Unlike the relational or SQL database, graph database treats relationships between data equally important to the data itself. Because of its inherent features such as index-free adjacency, reduced complexity, flexible schema and easy correlation, it is most suited to analyse the connected components.
Building 360° network visualization is much more than just the data storage
Focusing only on the data storage (in Graph Database) can be a futile attempt unless DSPs do not create an effective upstream data ingestion and downstream data visualization strategy.
This article elaborates on the above mentioned two key elements and brings out the required capabilities in order to build them effectively. Implementing 360° real-time network visualization approach discussed here can enable an intelligent and convergent view of the network, which favours the growing demands of network planning, network operation center (NOC) engineers and various business functions in a DSP.
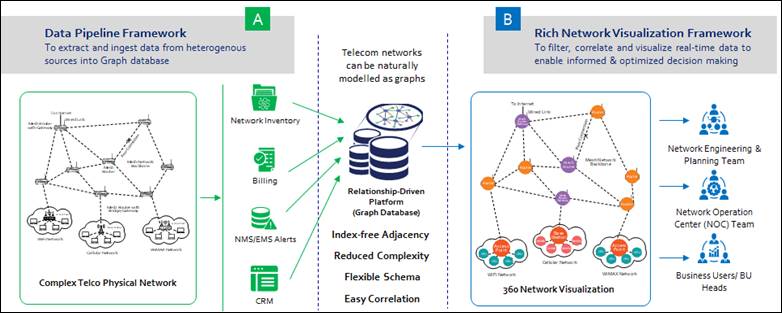
Fig: Data pipeline and visualization framework: Two key ingredients for building 360° network visualization leveraging graph database
Solution approach for building the data pipeline framework
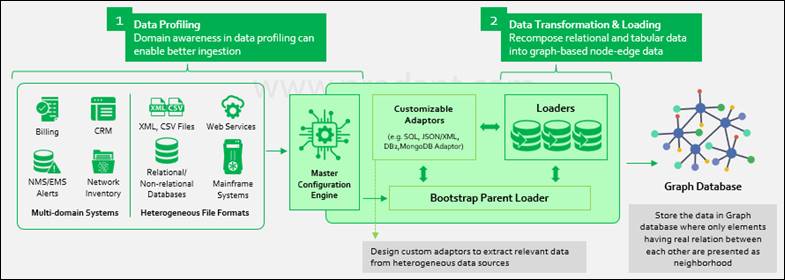
Fig: Data Pipeline Framework to extract and ingest data from heterogenous sources into a Graph database
Data Profiling
Data ingestion is carried out with multi-domain systems represented by heterogeneous file formats that comes at variable speeds. Having good domain awareness is key for better profiling of the relevant data and preparing it for graph database storage.
Filter Out Network Domain-level Data Points
It requires identifying disparate systems and their subsets, filtering relevant equipment details (racks, shelfs, cards), circuit details & other system details and identifying subcomponent details such as mounting position, port address and circuit position.
Collect Principal Parameters with Dimensionality Reduction and Proper Categorization
This step requires identifying what data belongs to nodes & what belongs to edges. Furthermore, identifying key properties associated with vertex, edges and their interconnection and analysis of relationship between different vertices (one-to-one, one-to-many relationship, hierarchical or a flat relation) is also necessary.
Design the approach for ingesting profiled data in a planned manner
- Plan out data ingestion frequency based on the type of source data. For e.g. live traffic data needs to be ingested every 15 minutes or EDR (end of the day record) requires daily ingestion while billing data can be ingested monthly.
- Compute capacity is required for ingesting at desired frequency. Mutually exclusive subsets should run in parallel or else it can create redundancy issues.
- Decide the suitable filtering criteria: It can be time-based, parameter-based, location-based or device-based filtering.
Identifying the querying format is required to extract data from different source systems. Corresponding query adaptors such as Kafka streams, MongoDB, SQL, XML/JSON, DB2 or other customized queries can be triggered accordingly.
Data Transformation and Loading
Recomposing Relational and Tabular Data into Graph-Based Node-Edge Data
Transforming relational and tabular data to Graph databases can be challenging when the mission critical applications are in the backend. Thus, bringing domain expertise and the best practices in Graph database deployment can ease the pain of the transition. Mapping relationship for inventory and network design is the key contribution from domain experts. This involves identifying key relational parameters such as circuit design ID & equipment ID that needs to be mapped to vertex. Traversing relationship between network attributes can be automated using best practices in the Graph database design. These relationships can be traversed with the following key attributes:
- Mounting position edge – connection between two equipment
- Circuit position edge – connection between two circuits
- Port address edge – connection between circuits & equipment
Design Configurable Loader Component with Following Attributes:
- Form the required relationships between vertices (one-to-one, one-to-many) based on the properties associated with identified parameters.
- Extract multiple entities and relationships using relevant adaptors based on querying format.
- Traverse some major relations manually, while most of the relations can be automated based on the identified pattern.
Process multiple threads & load from different sources in parallel.
Strategic Considerations for Creating a Rich Network Visualization Framework
The visualization framework addresses the disparate needs of network design engineers, NOC teams, and business managers, who will ultimately use the same data in different forms to make decisions.
Use force directed graph for interactive & dynamic visualization
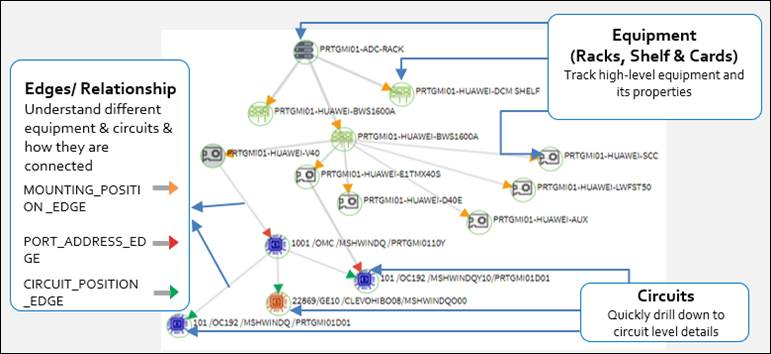
Fig: Sample force directed view of network equipment, circuits & their relationship
Force directed graphs can help the DSPs to reduce new network design and rollout time by up to 33% by providing a “single source of truth” for the entire network, easy traversal & fast retrieval of relevant data and effectively designing alternate routes. These graphs can be created by building an easy to use GUI-based query builder tool which provides simple widgets and relevant filters to build complex queries, thus avoiding dependencies on coding skills. Tools such as D3.js can be used as it supports granular level of customization & interoperability.
Use hierarchical graph visualization to get holistic view of all devices at a specific location
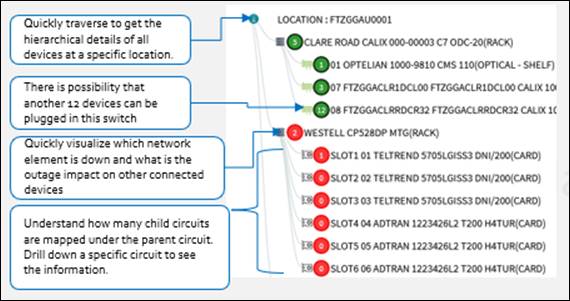
Fig: Sample hierarchical-view of network assets.
This form of visualization can support NOC engineers with faster network troubleshooting & impact assessment. It also enables engineers to quickly assess which elements will be impacted if a specific circuit goes down.
Use geographical view of network systems to map physical location of devices
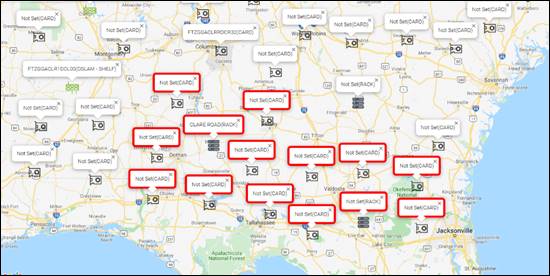 Fig: Sample geographical view of network assets. Devices marked in red shows geographical location of network equipment and circuits that are impacted with network outages
Both NOC engineers and network design teams can leverage this to fast-track and simplify key operational processes. Tools such as ArcGIS, OpenStreetMap or Google maps can be used to support geographical visualization by integrating it with the visualization framework.
Implementing 360° network visualization approach discussed in this insight can help DSPs achieve various business and operational benefits such as:
- Reducing new network design rollout time by up to 33%
- Fast-tracking troubleshooting process with 67% increase in overall efficiency
- Understanding revenue generation from individual equipment
Authors
- Rajesh Ramaswamy Sampathkumar, Director, NextGen Technology Practice, Prodapt
- Sumit Thakur – Manager, Strategic Insights, Prodapt
- Jagadeesh Bhavanasi– Senior Technical Lead, NextGen Technology Practice, Prodapt
- Kalyanakannan D M – Technical Lead, NextGen Technology Practice, Prodapt
If you haven't already, please take our Reader Survey! Just 3 questions to help us better understand who is reading Telecom Ramblings so we can serve you better!
Categories: Industry Viewpoint · Software · Uncategorized
Informative!!!